Possibly pithy insights into computer performance analysis and capacity planning based on the Guerrilla series of books and training classes provided by Performance Dynamics Company.
Wednesday, December 22, 2010
Season's Greetings 2010
Unfortunately, computer performance analysis and capacity planning doesn't extend to improving the weather in the northern hemisphere. All hate-mail should be sent to Prime Minister Julia Gillard.
Saturday, November 13, 2010
Reporting Standard Errors for USL Coefficients
....
BS> Using gnuplot against the dataset I gave, I get
BS>    sigma   0.0207163 +/- 0.001323 (6.385%)
BS>    kappa   0.000861226 +/- 5.414e-05 (6.287%)
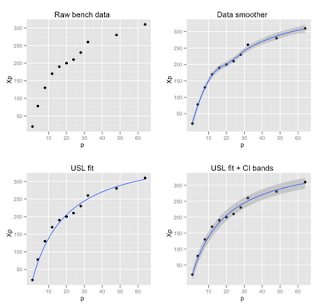
The Gnuplot output includes the errors for each of the universal scalability law (USL) coefficients. A question about the magnitude of these errors also arose in a recent talk I gave. Typically, this question doesn't come up because there's more focus on assessing the residual errors as a measure of fit for the USL against the data set. Also, statistical accuracy can be a bigger issue when there are only a small number of samples. Barron reported 32 data points, so that's not an problem in this case.
Monday, November 8, 2010
Efficient Elevators: Algorithms, Cars and Queues
- Vol 1, p.280: elevator simulator program based on doubly-linked lists
- Vol 3, p.150: elevator scheduling as priority queues
- Vol 3, p.357: tape sorting reformulated as single elevator problem
- Vol 3, p.374: disk seeks treated as single elevator problem

[Best wishes for Randall's fiancée]
Saturday, November 6, 2010
Cooking Up Some Hotsos for 2011
Hotsos is a great conference that is Oracle-related but not Oracle-sponsored. As the name implies, the focus is on the performance of Oracle databases and applications, but it's been my experience that attendees are very keen to know about performance techniques, not matter what their context.
Hotsos 2011 will give me an opportunity to expand on my Nov 2007 observation that the USL contains a representation of the mythical man-month. In other presentations I've always talked about characterizing throughput scalability, but this time I'll extend the USL to quantifying response-time scalability.
Tuesday, October 5, 2010
Plan for Guerrilla Capacity Planning in November

As usual, it will be held at our lovely Larkspur Landing location. Click on the image for booking information.
Attendees should bring their laptops, as course materials will only be provided on CD or flash drive. We will be distributing free notepads so you can also take hand-written notes. The venue also has free wi-fi to the internet.
Tuesday, September 7, 2010
Confidence Bands for Universal Scalability Models
Monday, August 30, 2010
Where to Start with PDQ?
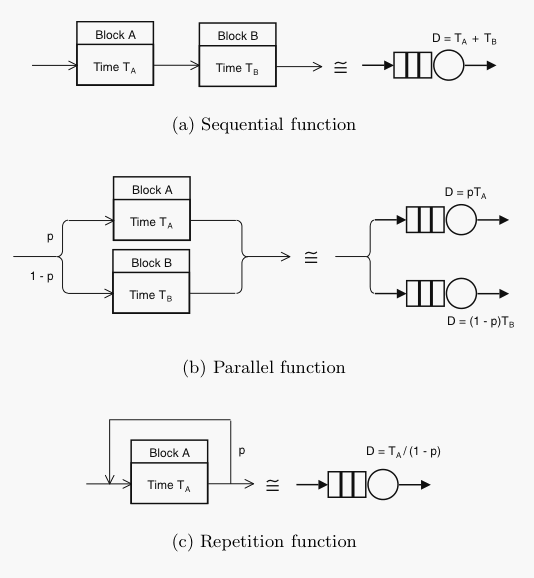
Since all digital computers and network systems can be considered as a collection of functional blocks and these blocks often contain buffers, their performance can be modeled as a collection of buffers or queues. Therefore, start developing your PDQ model by drawing a functional block diagram of the relevant architecture using elements like these:
Wednesday, August 25, 2010
Excel Errors and Other Numerical Nightmares
Monday, August 16, 2010
Gone Guerrill_ R on Our Data
- Neural nets pkg nnet applied to CPU performance data in the Ripley and Venables book (see Section 8.10).
- How to do stacked plots that Jim calls "spark plots."
- Jim told us that ggplot has a nice GUI but considerably slower than using the base plot routines.
- Use of POSIXct to convert timestamps.
- Handling multi-line headers.
- Handling multi-word fields in headers.
- To make getwd() like the UNIX shell command: pwd<-function(){cat(getwd())}.
- Think of lapply as a vectorized for-loop.
- Calculating confidence intervals, which David explained earlier in the week, is available as the CI function in gmodels pkg on CRAN.
- Fourier Transform Your Data. This was done using Mathematica but the same thing can be accomplished with the fftw pkg on CRAN.
- VAMOOS your data.
Thursday, August 12, 2010
GDAT: Fourier Transform Your Data
Here is a nice little video demonstration of the Fourier theorem in action using a Hammond B3 electronic organ—an instrument capable of mimicking other instruments through the use of the Fourier theorem.
What would happen if we tried to apply the Fourier theorem to performance or capacity planning data?
Wednesday, August 11, 2010
GDAT Visualization: Black Friday at eBay

was brought to our attention in the GDAT class today, compliments of Matt C. from PayPal.
Sunday, August 1, 2010
Florence Nightingale was a Statistician
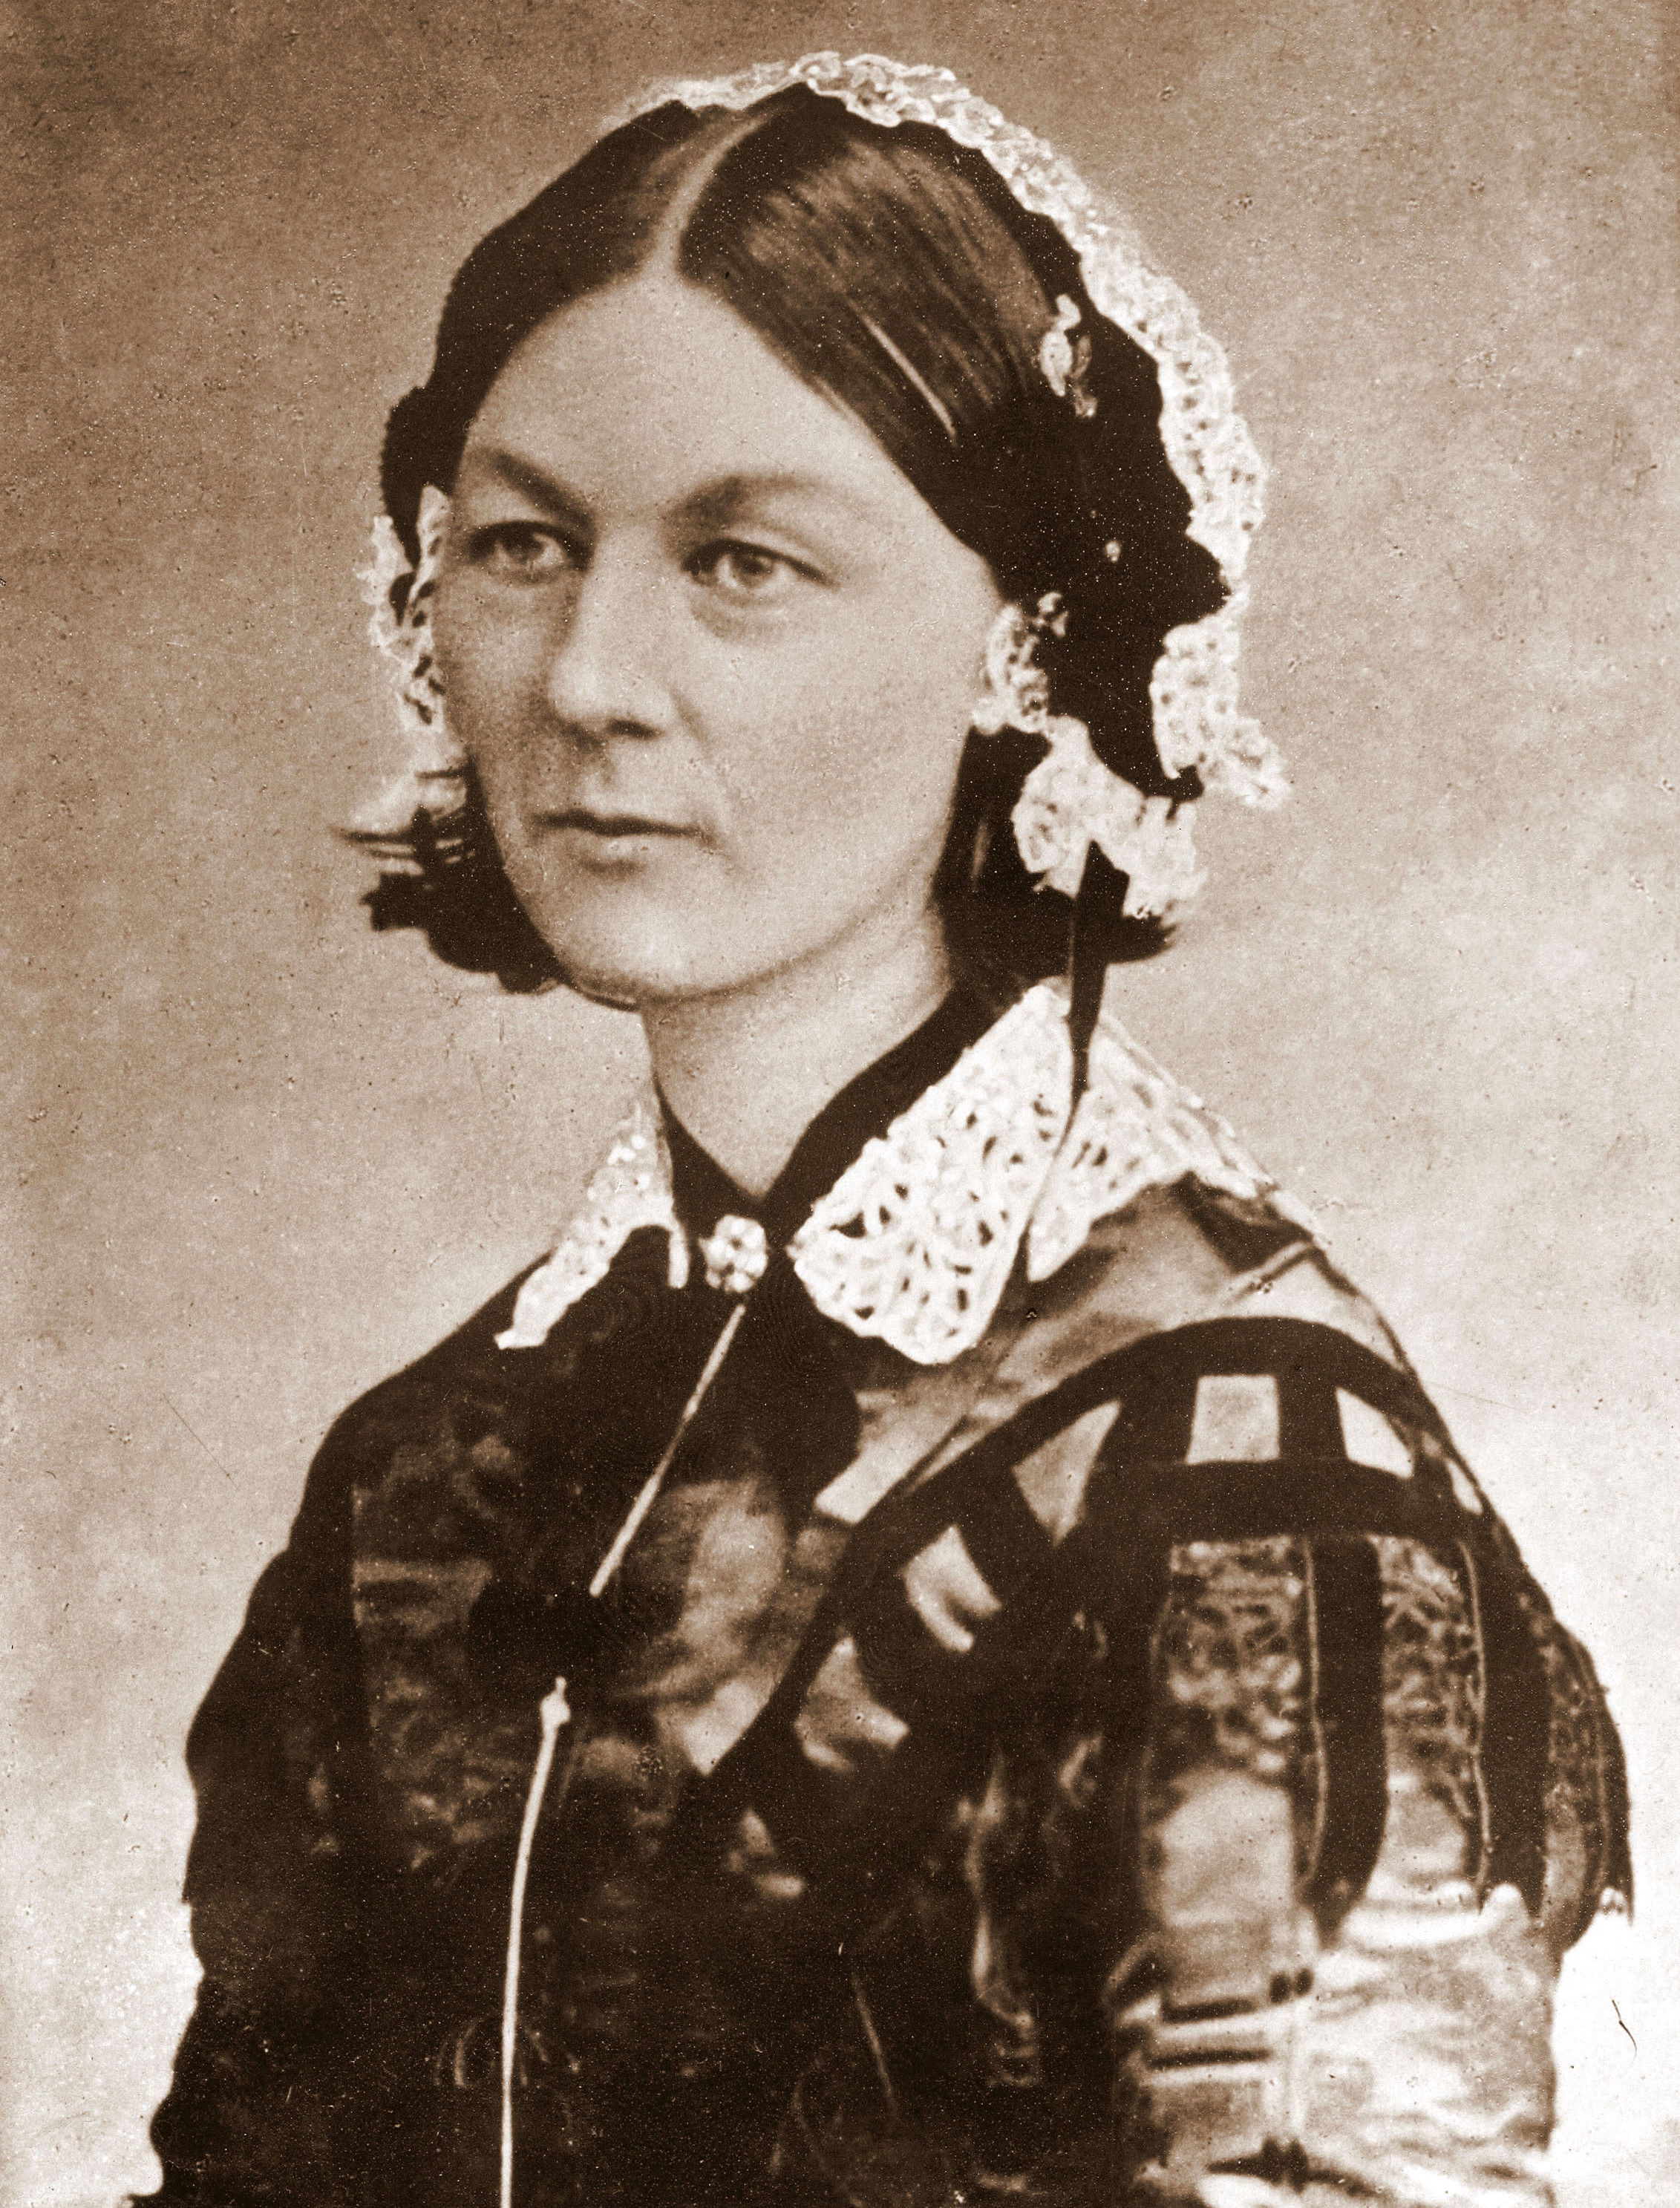 |  |
Moreover, she was also a pioneer in data visualization by virtue of developing a form of pie chart known today as the polar area diagram.
Sunday, July 25, 2010
World Datacenter Storage at 1 ZB
"The world is drowning in a sea of data. Facebook users alone are uploading more than a thousand photos a second. We're now seeing an exponential explosion of information. So how much information are we really storing?"
Monday, July 5, 2010
Go Guerrill-R on Your Data in August

(Click on the image for details)
For those of you coming from international locations, here is a table of currency EXCHANGE rates. We look forward to seeing all of you in August!
Prime Parallels for Load Balancing
Friday, June 25, 2010
Velocity 2010 The Aftermathglow

Thread-limited scalability of memcached
Working with Shanti and Stefan of Oracle (née Sun Microsystems), I was able to accomplish that goal. Our session was rated 92.4%, which is an A+ in anyone's books. Congrats to us and the Velocity organizers and thank you, crowd.
Tuesday, June 22, 2010
Linear Modeling in R and the Hubble Bubble
Monday, June 21, 2010
Memcached and Friends at Velocity 2010

Click on the image for details
Shanti and I will be presenting at 1300 on Thursday. The Velocity conference is being held at the Hyatt Regency Santa Clara, near Great America.
Thursday, June 17, 2010
Playing with Primes in R (Part II)
Sunday, June 13, 2010
Primes in R (Part III): Schoolmath is Broken!
Tuesday, June 8, 2010
Go Guerrill-R on Your Data in August

(Click on the image for details)
For those of you coming from international locations, here is a table of currency EXCHANGE rates. We look forward to seeing all of you in August!
Sunday, June 6, 2010
Calculating the Cost of Elastic Capacity

Sunday, May 30, 2010
Simulating a Queue in R
Saturday, May 22, 2010
Jackson's Theorem for the Cloud
Thursday, May 20, 2010
Load Testing Think Time Distributions
To make this point a bit clearer, I used the very convenient variate-generation functions in R to compare some of the distributions that I consider should be included in such a library for the convenience of workload-test designers and performance engineers. The statistical mean (i.e., the average think delay) is the same in all these plots and is shown as the red vertical line, but pay particular attention to the spread around the mean on the x-axis.

Tuesday, May 18, 2010
Intel's Cloud Computer on a Chip
The "cloud" reference is a marketing hook, but note that it uses a 2D mesh interconnect topology (like we discussed in class), contains 1.3 billion transistors with the new Hafnium metal gate (as we discussed in class), and produces up to 125 watts of heat.
This Intel processor (code named "Rock Creek") integrates 48 IA-32 cores, 4 DDR3 memory channels, and a voltage regulator controller in a 6×4 2D-mesh network-on-chip architecture. Located at each mesh node is a five-port virtual cut-through packet switched router shared between two cores. Core-to-core communication uses message passing while exploiting 384KB of on-die shared memory. Fine grain power management takes advantage of 8 voltage and 28 frequency islands to allow independent DVFS of cores and mesh. At the nominal 1.1V, cores operate at 1GHz while the 2D-mesh operates at 2GHz. As performance and voltage scales, the processor dissipates between 25W and 125W. The 567 sq-mm processor die is implemented in 45nm Hi-K CMOS and has 1,300,000,000 transistors.
The details of this processor were presented at the annual ISSCC meeting in San Francisco, February 2010.
Saturday, May 15, 2010
Emulating Web Traffic in Load Tests
Friday, May 14, 2010
GCaP Class Highlights
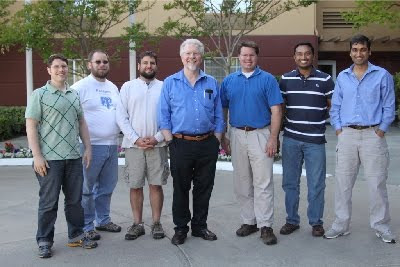
Some graduates of the May 2010 GCaP class. Photo courtesy Manu M.
Here are some of the interesting topics that popped up in class discussions this week:
- How to emulate Internet traffic with load test tools like LoadRunner
- Contol Groups (cgroups) for fair-share resource allocation in Linux containers—not to be confused with CFS (completely fair scheduler)
- Demo of JXinsight by the tool architect (and now Guerrilla graduate) William Louth
- DTrace for Solaris and Mac OS X
- Instruments in Mac OS X (Leopard and higher)
- The performance and capacity implications of cloud computing
- How to get started doing GCaP with VAM: Visualize, Analyze, Modelize
- httperf web workload generator
Monday, May 10, 2010
BRL-CAD Benchmark and USL Modeling
"I understand that system characteristic is in α and β and the interpretation is the key. And that there is aggregation. In GCaP [book] (in table 5.1) there are ray tracing benchmark results - what is workload (users, tasks) described in such case? Numbers? Is it Xmax on given processor in this table? - so processor p1 is loaded to measure Imax, next p4 is loaded to measuer Imax? - isn't task or user number important for given p-Imax?"
Sunday, May 9, 2010
Using Think Times to Determine Arrival Rates
Mapping Virtual Users to Real Users
A commonly used practical approach to ameliorate this circumstance is to run the load test scenarios with zero think time (i.e., Z = 0) in the client scripts on the driver (DVR) side of the test rig. This choice effectively increases the number of active transactions running on the system under test (SUT), which might include apps servers and database servers. These two subsystems are usually connected by a local area network, as shown in the following diagram.

Friday, April 16, 2010
Significant Figures in R and Rounding
Once we know how to identify significant digits, inevitably we will be faced with rounding the result of a calculation to the least number of sigdigs. Whereas the signif() function in R suffered from truncating trailing info-zeros in measured values, when it comes to rounding, signif shines. Better yet, it agrees with the Algorithm 3.2 in my GCaP book. Let's see how well it does.
Sunday, April 11, 2010
Significant Figures in R and Info Zeros
Thursday, April 8, 2010
Plan for Guerrilla Capacity Planning in May

Blast from the past. Some members of the 2006 class. Courtesy Tony Aponte
For those of you coming from international locations, here is a table of currency exchange rates.
(Click on the image for more details)
All Guerrilla classes have a certification level 1, 2, 3, but there are no prerequisites at this time.
Sunday, March 21, 2010
Bandwidth vs. Latency — The World is Curved
Window on the World
In part, it depends on your window to the world. When we look out a window, the Earth looks flat.
Occasionally, we are reminded that the Earth is actually curved. That's something most of us accept and expect, even if we're not aware of it all of the time.
Friday, March 19, 2010
Memcached Scalability at Velocity 2010

Here's our abstract:
Hidden Scalability Gotchas in Memcached and Friends
Neil Gunther (Performance Dynamics), Shanti Subramanyam (Oracle Corporation), Stefan Parvu (Sun Microsystems)
Most web deployments have standardized on horizontal scaleout in every tier—web, application, caching and database—using cheap, off-the-shelf, white boxes. In this approach, there are no real expectations for vertical scalability of server apps like memcached or the full LAMP stack. But with the potential for highly concurrent scalability offered by newer multicore processors, it is no longer cost-effective to ignore their underutilization due to poor, thread-level, scalability of the web stack. In this session we show you how to quantify scalability with the Universal Scalability Law (USL) by demonstrating its application to actual performance data collected from a memcached benchmark. As a side effect of our technique, you will see how the USL also identifies the most signficant performance tuning opportunities to improve web app scalability.
Thursday, March 11, 2010
Human Metro Map and Performance Management
This notion leads to Guerrilla Mantra 2.4:
A performance model is more like a map of a metro rail system than a scaled replica of the metro railway.
Quantum Camera Cited in HP Labs Annual Report

The joint work we published last year on quantum information processing, in New Journal of Physics and Optics Express, has been cited on p. 29 of the 2009 HP Labs Annual Report.
Friday, February 19, 2010
Guerrilla Boot Camps Coming Up

(Click on the image for more details)
Upcoming options:
- Two-day, entry-level Guerrilla Boot Camp runs Mar 25-26
- Back-2-back Boot Camp and full Guerrilla CaP course runs May 6-14
We look forward to seeing all of you here!
Friday, February 5, 2010
Guerrilla Mantras Now Updated on Twitter

To this end, the Guerrilla Manual is provided as a pull-out booklet in the rear jacket of my Guerrilla Capacity Planning book. Now, for an even more rapid-fire response, Guerrilla mantras (140 characters or less) are automatically posted on Twitter. Look for the GMantra tag.
Wednesday, February 3, 2010
A4 (ain't just paper anymore): Apple's New Chip
"For the first time, Apple has built it’s own chip for a product. For years, the company has worked with others, first Motorola and then IBM, to build its processors. But for the iPad, the company debuted its A4 chip. The chip came via its acquistion of P.A. Semi in 2008. Building its own chip reportedly was one of the key reasons Apple was able to bring the cost of the iPad down. But early reviewers have also noted the iPad’s speed at rendering Web pages. The A4 potentially puts Apple in a position to build more of its own chips, and it also sets up a new rivalry against Intel for the mobile computing business."
Apple has built chips before; he means home-grown microprocessor.
Tuesday, February 2, 2010
NorCal ORACLE User Group Meeting
I will be presenting both:
- a Keynote: "Why Are There No Giants?" (9:30 - 10:30) and
- a Technical Session: “Performance Analysis for Those Who Can't Wait” (beginner's level, 11:00 - Noon)

