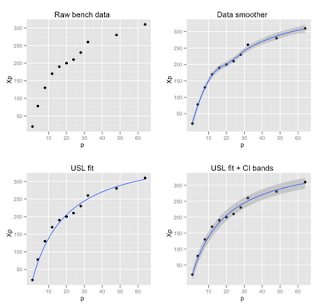
In the recent GDAT class, confidence intervals (CI) for performance data were discussed. Their generalization to confidence bands (CB) for scalability projections using the USL model also came up informally. I showed a prototype plot but it was an ugly hack. Later requests from GDAT attendees to apply CBs to their own data meant I had to do something about that. I tried a lot of things in R that didn't produce the expected results. Ultimately, I was led to explore the ggplot2 package—the "gg" stands for grammar of graphics. A set of ggplots, corresponding to the VAMOOS stages of USL analysis, is shown in Figure 1.
