....
BS> Using gnuplot against the dataset I gave, I get
BS>    sigma   0.0207163 +/- 0.001323 (6.385%)
BS>    kappa   0.000861226 +/- 5.414e-05 (6.287%)
The Gnuplot output includes the errors for each of the universal scalability law (USL) coefficients. A question about the magnitude of these errors also arose in a recent talk I gave. Typically, this question doesn't come up because there's more focus on assessing the residual errors as a measure of fit for the USL against the data set. Also, statistical accuracy can be a bigger issue when there are only a small number of samples. Barron reported 32 data points, so that's not an problem in this case.
Saturday, November 13, 2010
Reporting Standard Errors for USL Coefficients
In a recent Guerrilla CaP Group discussion, Baron S. wrote:
Monday, November 8, 2010
Efficient Elevators: Algorithms, Cars and Queues
The latest PBS NOVA episode entitled "Trapped in an Elevator" is based on an actual event that occurred in 1999. Watching it reminded me that elevators (or lift in British english) can be regarded as a queueing system, viz., priority queues, which are also the basis for scheduling algorithms in operating systems and storage devices. A lot of this background can be found in Don Knuth's erudite volumes:
[Best wishes for Randall's fiancée]
- Vol 1, p.280: elevator simulator program based on doubly-linked lists
- Vol 3, p.150: elevator scheduling as priority queues
- Vol 3, p.357: tape sorting reformulated as single elevator problem
- Vol 3, p.374: disk seeks treated as single elevator problem
[Best wishes for Randall's fiancée]
Saturday, November 6, 2010
Cooking Up Some Hotsos for 2011
Just got word that my proposed presentation "Brooks, Cooks and Response Time Scalability" has been accepted for the Hotsos Symposium, March 2011 in Dallas, Texas.
 Hotsos is a great conference that is Oracle-related but not Oracle-sponsored. As the name implies, the focus is on the performance of Oracle databases and applications, but it's been my experience that attendees are very keen to know about performance techniques, not matter what their context.
Hotsos 2011 will give me an opportunity to expand on my Nov 2007 observation that the USL contains a representation of the mythical man-month. In other presentations I've always talked about characterizing throughput scalability, but this time I'll extend the USL to quantifying response-time scalability.
Hotsos 2011 will give me an opportunity to expand on my Nov 2007 observation that the USL contains a representation of the mythical man-month. In other presentations I've always talked about characterizing throughput scalability, but this time I'll extend the USL to quantifying response-time scalability.
Tuesday, October 5, 2010
Plan for Guerrilla Capacity Planning in November
You can still pile into the final Guerrilla Capacity Planning (GCaP) class for 2010 at the Early Bird rate. Before signing up, you can review the highlights of the May GCaP class. If you came to the August GDAT class, but missed the previous GCaP class, here is your chance to catch up.

As usual, it will be held at our lovely Larkspur Landing location. Click on the image for booking information.
Attendees should bring their laptops, as course materials will only be provided on CD or flash drive. We will be distributing free notepads so you can also take hand-written notes. The venue also has free wi-fi to the internet.
Tuesday, September 7, 2010
Confidence Bands for Universal Scalability Models
In the recent GDAT class, confidence intervals (CI) for performance data were discussed. Their generalization to confidence bands (CB) for scalability projections using the USL model also came up informally. I showed a prototype plot but it was an ugly hack. Later requests from GDAT attendees to apply CBs to their own data meant I had to do something about that. I tried a lot of things in R that didn't produce the expected results. Ultimately, I was led to explore the ggplot2 package—the "gg" stands for grammar of graphics. A set of ggplots, corresponding to the VAMOOS stages of USL analysis, is shown in Figure 1.

Monday, August 30, 2010
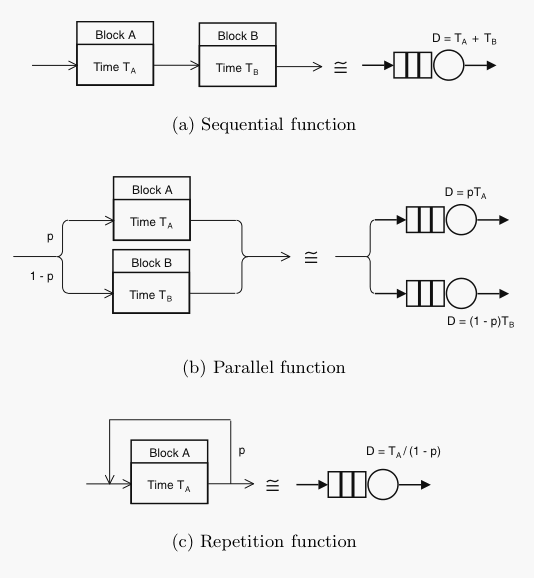
Where to Start with PDQ?
Once you've downloaded PDQ with a view to solving your performance-related questions, the next step is getting started using it. Why not have some fun with blocks? Fun-ctional blocks, that is.
Since all digital computers and network systems can be considered as a collection of functional blocks and these blocks often contain buffers, their performance can be modeled as a collection of buffers or queues. Therefore, start developing your PDQ model by drawing a functional block diagram of the relevant architecture using elements like these:
Since all digital computers and network systems can be considered as a collection of functional blocks and these blocks often contain buffers, their performance can be modeled as a collection of buffers or queues. Therefore, start developing your PDQ model by drawing a functional block diagram of the relevant architecture using elements like these:
Wednesday, August 25, 2010
Excel Errors and Other Numerical Nightmares
Although I use Excel all the time, and I strongly encourage my students to use it for performance analysis and CaP, I was forced to include a warranty disclaimer in my GCaP book because I discovered a serious numerical error while writing Appendix B. There, my intention was just to show that Excel gives essentially the same results as Mathematica when using the USL scalability model. It didn't!
Subscribe to:
Comments (Atom)