 |  |
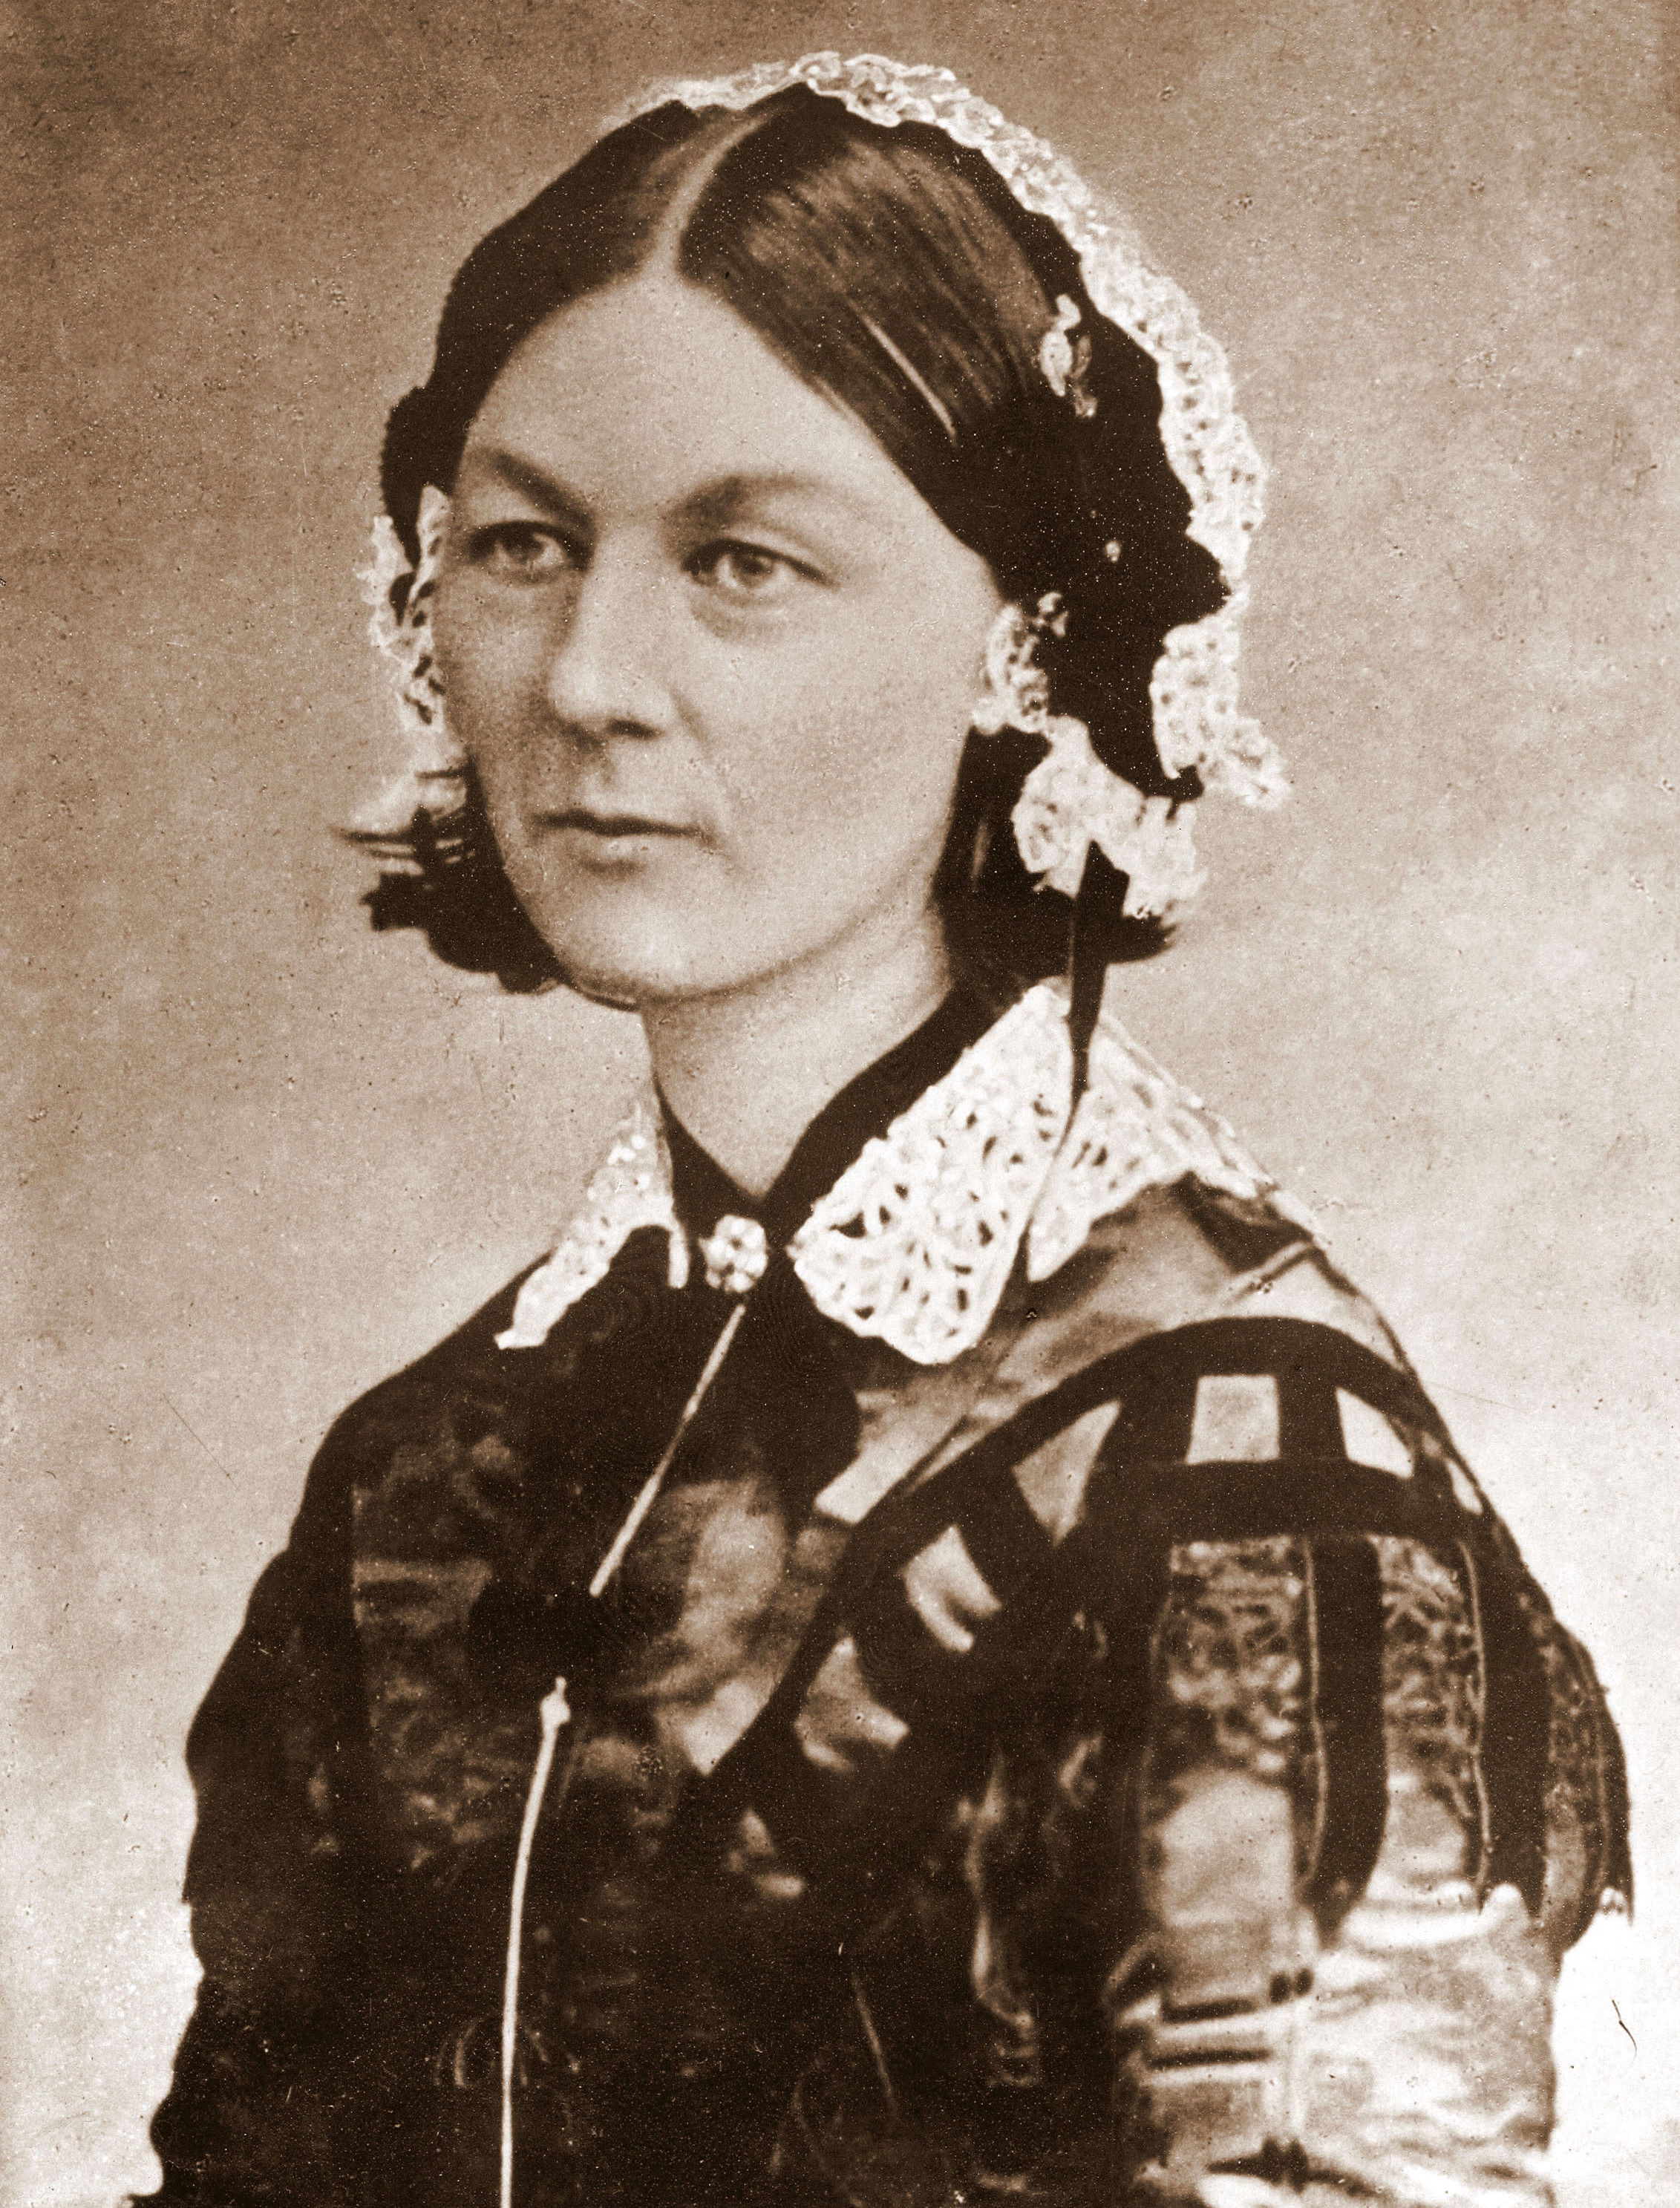
Moreover, she was also a pioneer in data visualization by virtue of developing a form of pie chart known today as the polar area diagram.
We'll be discussing visualization methods specifically for performance data in the upcoming Guerrilla Data Analysis Techniques class (week of August 9th). Some other topics I will be covering in the GDAT class include:
- The most famous scatter plot in history
- Deriving confidence intervals for performance measurements
- Understanding Web zone data
- Meaning of the Means (arithmetic, geometric and harmonic)
- How to do Fermi estimates
No comments:
Post a Comment