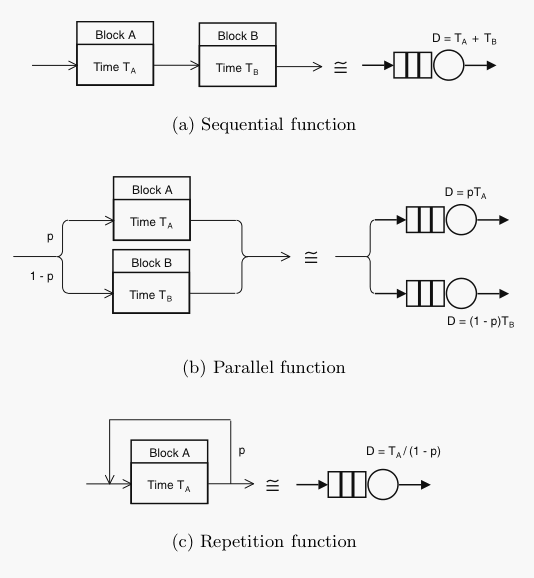
Once you've downloaded PDQ with a view to solving your performance-related questions, the next step is getting started using it. Why not have some fun with blocks? Fun-ctional blocks, that is.
Since all digital computers and network systems can be considered as a collection of functional blocks and these blocks often contain buffers, their performance can be modeled as a collection of buffers or queues. Therefore, start developing your PDQ model by drawing a functional block diagram of the relevant architecture using elements like these:
Possibly pithy insights into computer performance analysis and capacity planning based on the Guerrilla series of books and training classes provided by Performance Dynamics Company.
Monday, August 30, 2010
Wednesday, August 25, 2010
Excel Errors and Other Numerical Nightmares
Although I use Excel all the time, and I strongly encourage my students to use it for performance analysis and CaP, I was forced to include a warranty disclaimer in my GCaP book because I discovered a serious numerical error while writing Appendix B. There, my intention was just to show that Excel gives essentially the same results as Mathematica when using the USL scalability model. It didn't!
Monday, August 16, 2010
Gone Guerrill_ R on Our Data
Here's a summary of some things we learnt about applying R to computer performance and capacity planning data in the GDAT Class last week.
- Neural nets pkg nnet applied to CPU performance data in the Ripley and Venables book (see Section 8.10).
- How to do stacked plots that Jim calls "spark plots."
- Jim told us that ggplot has a nice GUI but considerably slower than using the base plot routines.
- Use of POSIXct to convert timestamps.
- Handling multi-line headers.
- Handling multi-word fields in headers.
- To make getwd() like the UNIX shell command: pwd<-function(){cat(getwd())}.
- Think of lapply as a vectorized for-loop.
- Calculating confidence intervals, which David explained earlier in the week, is available as the CI function in gmodels pkg on CRAN.
- Fourier Transform Your Data. This was done using Mathematica but the same thing can be accomplished with the fftw pkg on CRAN.
- VAMOOS your data.
Thursday, August 12, 2010
GDAT: Fourier Transform Your Data
The Fourier theorem essentially states that any arbitrary continuous function can be constructed by adding together sine and cosine functions with appropriately chosen amplitudes, frequencies and phases. This is what distinguishes two musical instruments, e.g., a violin and a trumpet, when they are both tuning to the same concert-A pitch. Each is playing the same fundamental frequency (440 Hz) but the higher harmonics; the additional sines and cosines overlaid on top of that fundamental tone, are what allows your ear to distinguish the violin sound from the trumpet sound.
Here is a nice little video demonstration of the Fourier theorem in action using a Hammond B3 electronic organ—an instrument capable of mimicking other instruments through the use of the Fourier theorem.
What would happen if we tried to apply the Fourier theorem to performance or capacity planning data?
Wednesday, August 11, 2010
GDAT Visualization: Black Friday at eBay
This animated heatmap visualization of Black Friday transaction volumes at eBay

was brought to our attention in the GDAT class today, compliments of Matt C. from PayPal.

was brought to our attention in the GDAT class today, compliments of Matt C. from PayPal.
Sunday, August 1, 2010
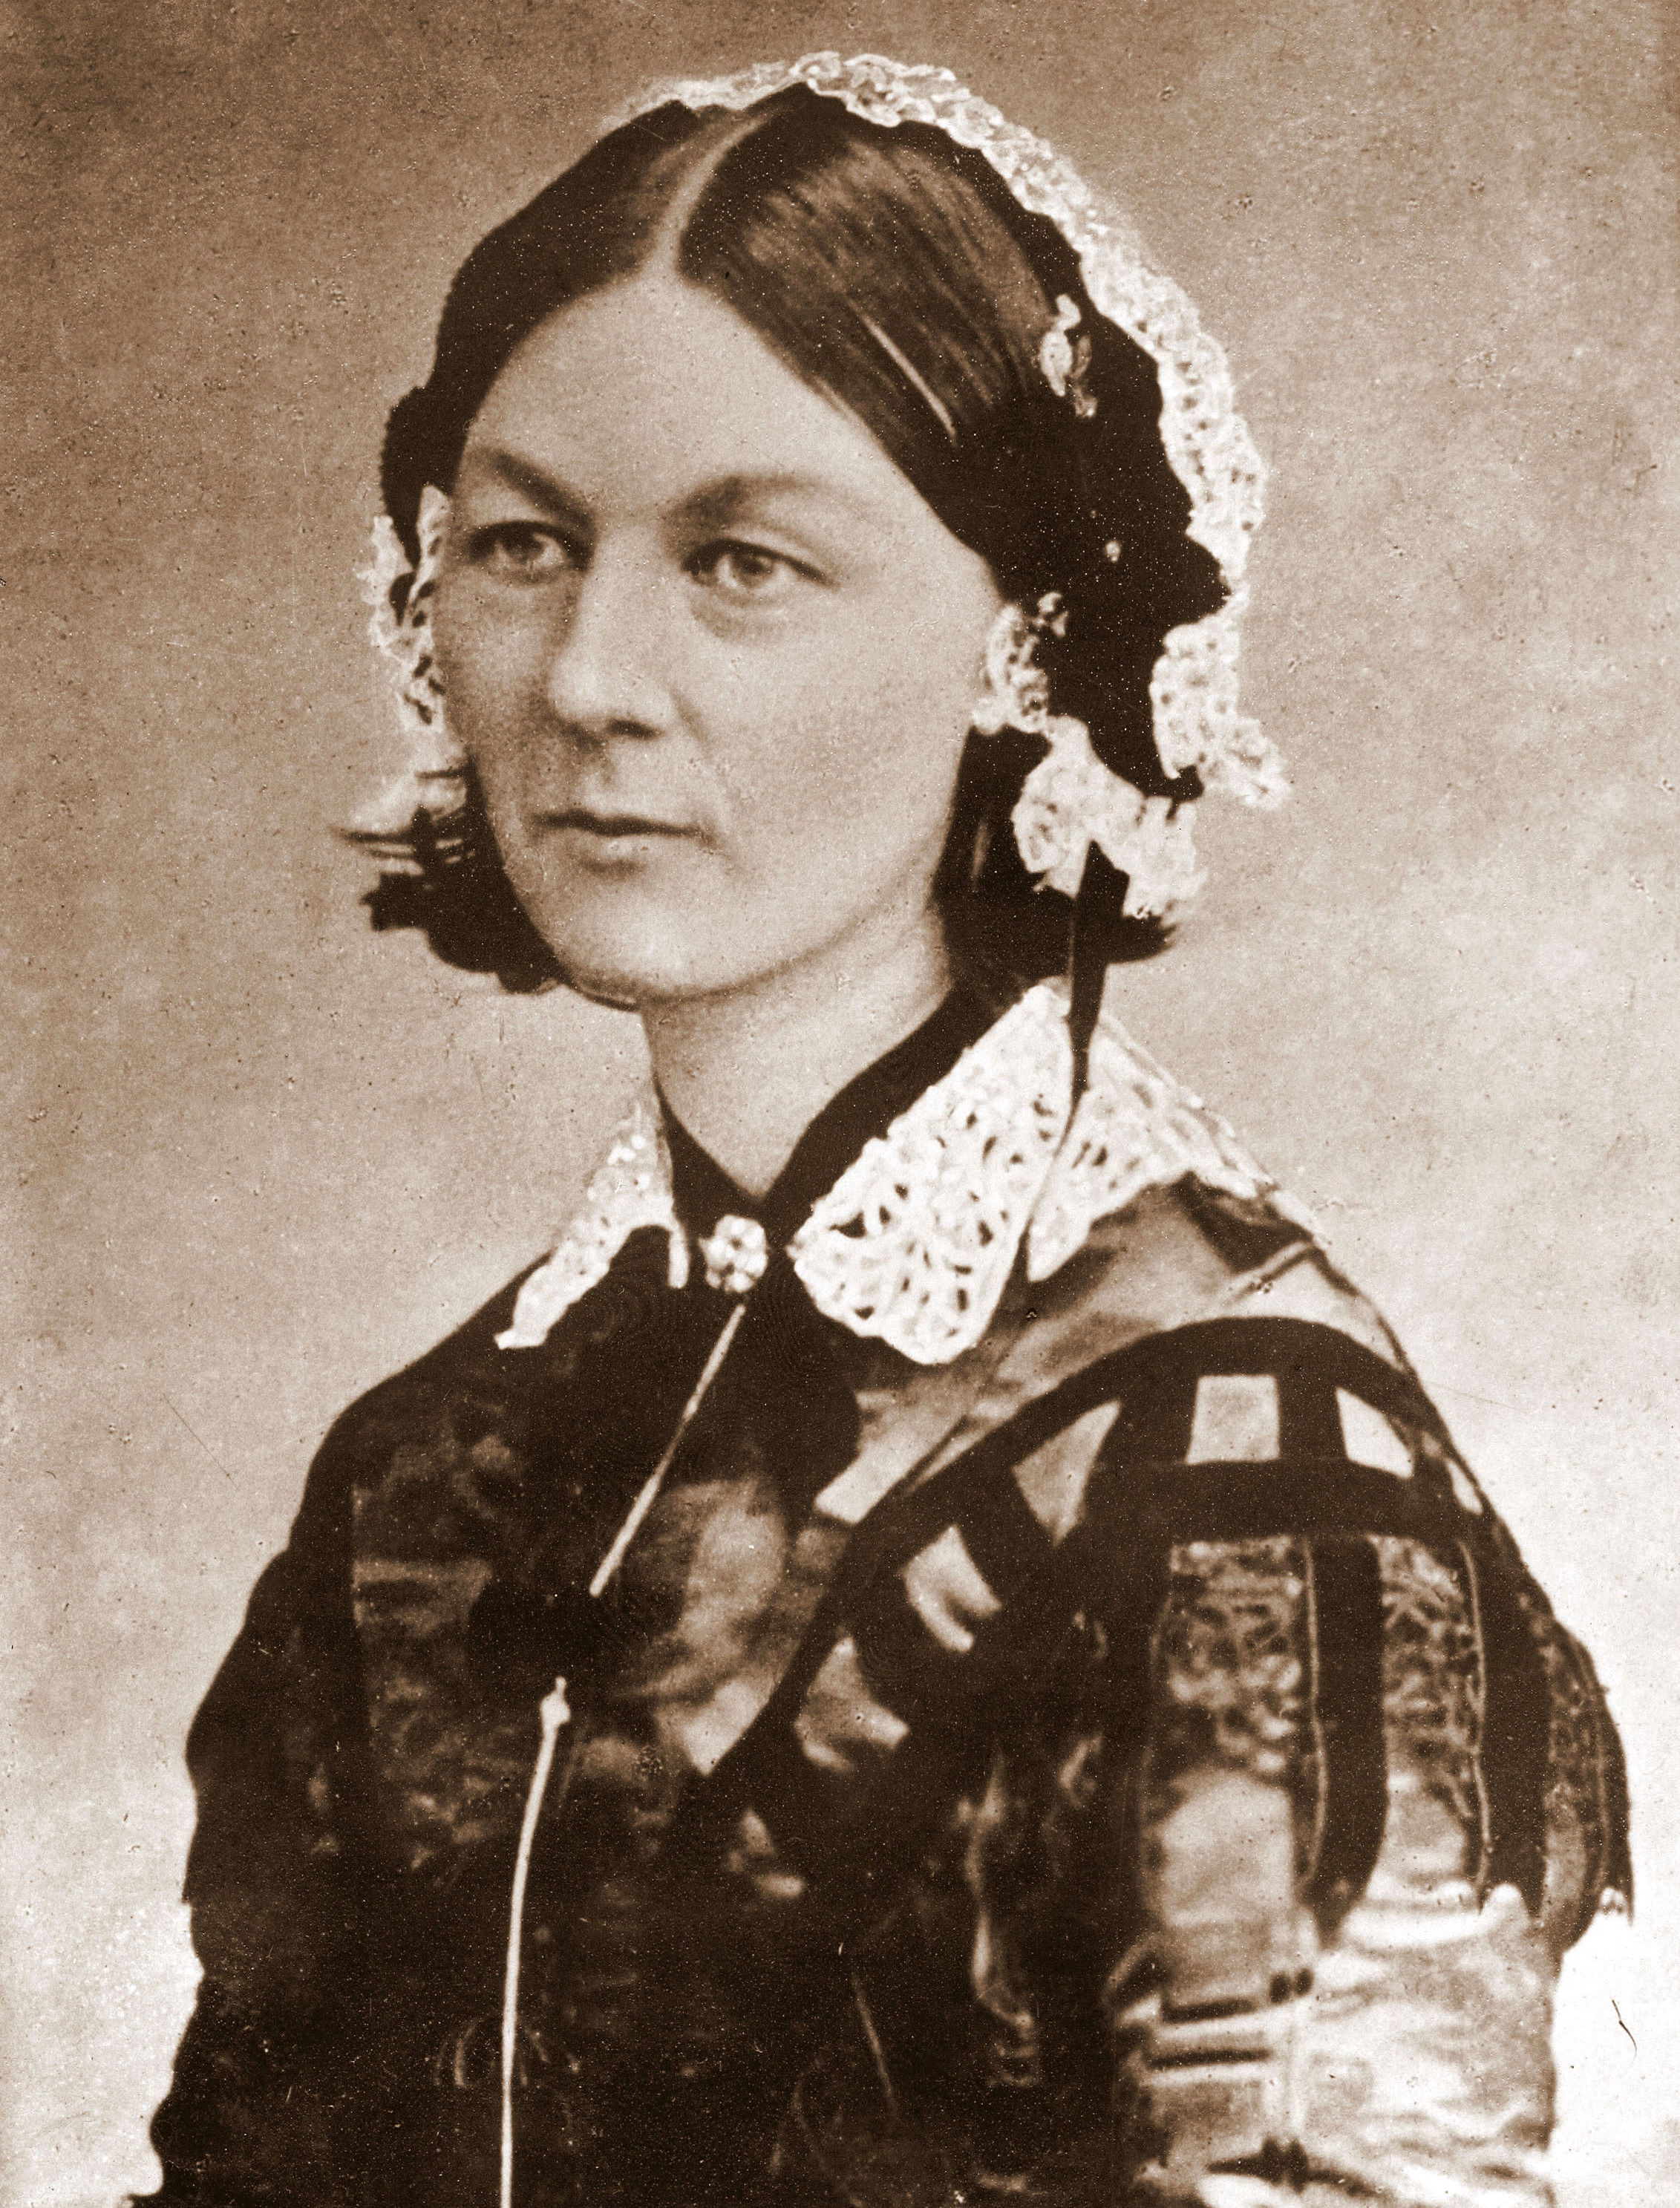
Florence Nightingale was a Statistician
Florence Nightingale was elected the first female member of the Royal Statistical Society in 1859 and she later became an honorary member of the American Statistical Association. She also travelled with a pet owl in her pocket. [Source: Graham Farmelo]
Moreover, she was also a pioneer in data visualization by virtue of developing a form of pie chart known today as the polar area diagram.
 |  |
Moreover, she was also a pioneer in data visualization by virtue of developing a form of pie chart known today as the polar area diagram.
Subscribe to:
Posts (Atom)
