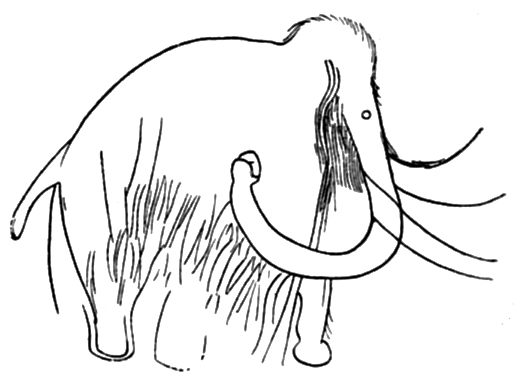
"With four parameters I can fit an elephant. With five I can make his trunk wiggle." —John von NeumannIn that vein, Guerrilla alumnus Stephen O'C. pointed me at a recent blog post and paper (PDF) that draws an elephantine curve using just 4 fitting coefficients or parameters. Stephen also sent me his translation of the Python code into R. Previous efforts apparently had required some 30 parameters. The secret to the success of this latest example is plotting the elephant in the complex plane by summing certain Fourier modes. That's all very cool but I was surprised to see that the output was static (no wiggles), even though 5 parameters are defined. That shortcoming, however, provided me with the impetus to try out R's animation package and here's the result.

Notice that my elephant not only wiggles his trunk but he also winks—a wiggling winking pink elephant. Actually, I think he looks more like a winking woolly mammoth. :)
Since I also know a thing or two about complex numbers and Fourier transforms, I found the Python code a bit obtuse but I didn't want to spend a lot of time rewriting it. Instead, I just looked for opportunities to:
- use the R animation package
- reorganize the code
- use R constructs such as lapply or sapply instead of loops
- use the fft (fast fourier transform) function in R
The resulting shape (and wiggling) of this elephant is controlled by a set of 5 (complex) parameters and their rotated complement. That's actually 20 numbers, but who's counting?
require(MASS)
library(animation)

mkmovie = TRUE  #guarantees some form of output

param <- c(50-30i,18+8i,12-10i,-14-60i,1+20i)
parar <- param * exp(1i*pi/2)  #rotate by 90 degrees

The first parameter produces an ellipse, the second makes a dent in the ellipse, while all 4 parameters together produce the base elephant shape. Roughly speaking, each parameter (p) produces p + 1 lobes in the 2D figure ... or are they limbs? The following R function assigns the parameters to the Fourier coefficients (Cx and Cy) to draw "pinky" the elephant.
pinky <- function() {
 Cx <- as.complex(rep(0,length(param)))
 Cy <- as.complex(rep(0,length(param)))
 tv <- seq(0,2*pi,length=1000)

 for (i in 1:2) { #movie frames
  Cx[1] <- parar[1] + Im(param[1])
  Cx[2] <- parar[2] + Im(param[2])
  Cx[3] <- Re(param[3])
  Cx[4] <- Re(param[5]) - (i-1)
  Cx[5] <- Re(param[4])

  Cy[1] <- param[1] - Re(param[1]) + Im(param[4])
  Cy[2] <- param[2] - Re(param[2])
  Cy[3] <- param[3] - Re(param[3])

  x <- c(fourier(tv, Cx))
  y <- c(fourier(tv, Cy))

  plot(y, -x, type="l", col='red', lwd=10, axes=FALSE, ylab='', xlab='')
  lines(y, -x, type="l", col='pink', lwd=4)
  if (i > 1) points(Im(param[5]), Im(param[5]), col='black', pch=126, cex=2)
     else points(Im(param[5]), Im(param[5]), col='black', pch=20, cex=2)
  }
}

The vectors Cx and Cy are used in the Fourier summation, which I've written as a recursive function.
fourier <- function(tt,cc) {
 wt <- rep(0, length(tt))
 fsum <- function(n) {
   if (n > 0) wt <- wt + fsum(n-1) + Re(cc[n]) * cos(n*tt) + Im(cc[n]) * sin(n*tt)
   return(wt)
 }
 fsum(length(cc))
}
I also tried to find a way to use lapply directly but I ran into a conflict between the size of the tt (time) vector versus the number of summation terms. In any event, I was quickly facing the prospect of writing some additional functions for lapply and it all started to feel like I was overloading its intent. Worse yet, I would also have ended up with more code than the original for-loop. Ultimately, I just replaced it with the recursive routine above and declared victory.
Finally, the two frames from the pinky function can be output optionally as an animated GIF, such as I've used here, or as two static plots in the standard R graphics window.
if (mkmovie) {
 aopt = ani.options(interval = 0, nmax = 2)
 saveMovie(pinky(), interval = 0.25, outdir = getwd(), width = 400, height = 400)
 ani.options(aopt)
} else pinky()
Thanks, Stephen!
11 comments:
Oh, you have done what I intended to do after reading John D. Cook's post a while ago. Thanks for sharing the fun! :)
BTW, I wish I could include this nice piece of animation in my package as a demo, so I'm writing to ask for permission here. I will attribute to you (and include the link) clearly in the code.
Hi Xie,
Sounds good. Let me know when you post it to your demo page.
Thanks for asking.
--njg
Me too! May I include the animation on my tumblr blog, Data Anxiety?
Your charming post and animation is already on tumblr (I can provide you with link under separate cover). It only appeared on one blog insofar as I could tell. The blog is in good taste, about science and big data. Your were given full attribution, by name and with link to this post.
I would like to feature your charming image, with attribution, and briefly mention R. I would link the image to your post here.
I am @EllieAsksWhy (am now following you) on the Twitter. May I have your permission please?
Hi Ellie. I don't see why not—it's all marketing. Right? :)
I see you have a post on Risk perception and reality. This is a very important but misunderstood topic for IT CaP and Perf (It's a BRisk Wind That Blows No Good); not to mention world economics. Quantifying the "percetion gap" is the tricky bit.
Neil,
I'm illustrating a dictionary of scientific quotes and wonder if you would be so kind as to grant me permission to reproduce your pink elephants.
Unfortunately, a Kindle ebook will not accommodate the winking pink elephant, but your figure demonstrating a fit to the outline of a elephant with four parameters would be a nice addition to the book. Full acknowledgment would be given.
Alfred Burdett
alfredburdett(at)gmail(dot)com
Hi Alfred. I can't think why not. Google probably owns everything on the web, anyway. :/
Perhaps you can report back when your book is available, so that any interested readers can take a look at it.
Neil, Thanks very much. The book should be available from Amazon shortly. I will provide a link.
Dear Neil,
I am an ex-physicist and now working at S&P Capital IQ.
I am seriously impressed by your elegant example of what von Neumann once said...I always thought it was a joke, but now... :-)
I would like to show your example, in a conference at RiskMinds2013.
The conference is about Risk in Finance, and I would like to stress - in a pictorial way - why it is important to build parsimonious mathematical models, else we risk stepping into elephants...
Would you please grant me permission for doing so?
I will obviously be quoting you and your website and send you an extract of the slides where I will mention you and your example.
Thanks,
Giorgio
Hi Giorgio, Glad you like it and I don't see any problem with using it, as long as you cite it. Look forward to seeing your slides. (Maybe I'm in the wrong job.)
Thanks so much!!
I will send you the slides as soon as ready!
Kind regards,
Giorgio
Post a Comment