In 2010, I wrote a
short blog item about
Florence Nightingale the
statistician, solely because of its novelty value. I didn't even bother to look closely at the associated graphic she designed, but that's what I intend to do here. In this first installment, I reflect on her famous data
visualization by reconstructing it with the modern tools available in R. In part two, I will use the insight gained from that exercise to go beyond data presentation to potentially more revealing data
modeling. Interestingly, I suspect that much of what I will present could also have been accomplished in Florence Nightingale's day, more than 150 years ago, albeit not as easily and not by her alone.
 |  |
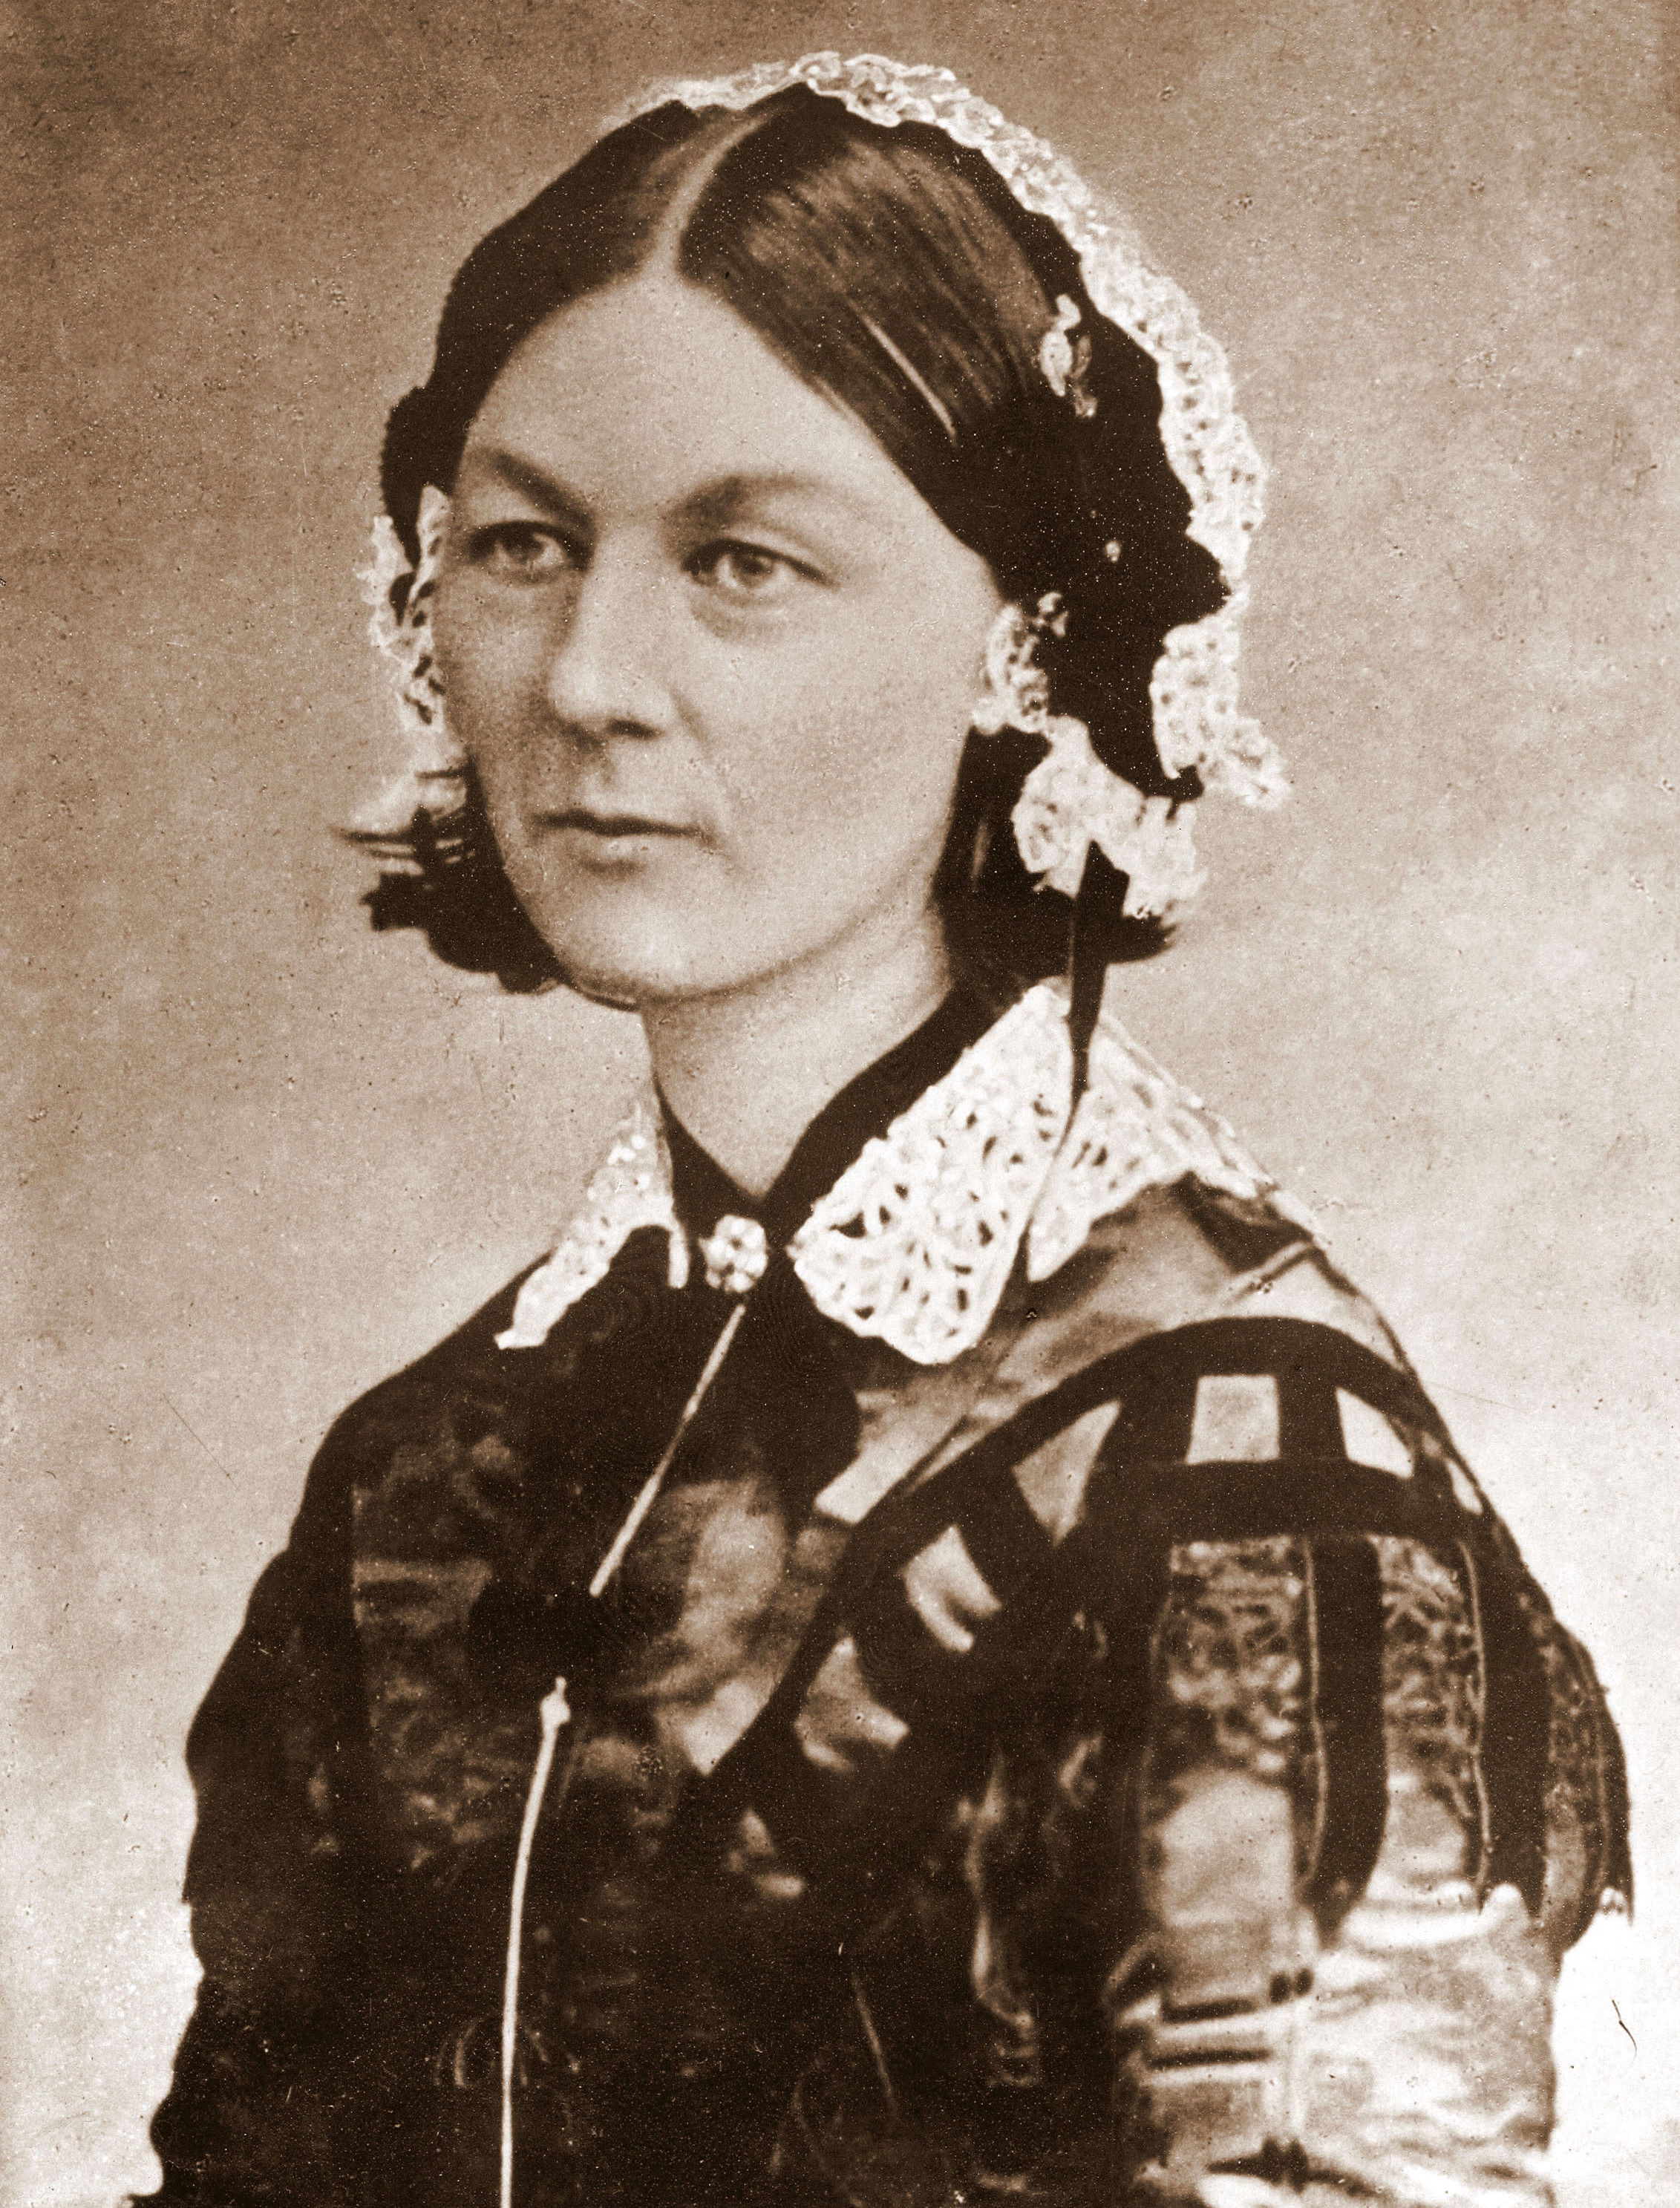
| Figure 1. Nightingale and her data visualization (click to enlarge) |
Although Florence Nightingale was not formally trained as a statistician, she apparently had a natural aptitude for mathematical concepts and evidently put a lot of thought into presenting the import of her medical findings in a visual way. Click on Figure 1 to enlarge it and view the details in her original graphic. As a consequence, she was elected the first female member of the Royal Statistical Society in 1859 and later became an honorary member of the American Statistical Association.
Why Wedges?
Why did FN bother to construct the data visualization in Figure 1? If you read her accompanying text, you see that she refers to the sectors as
wedges. In a nutshell, her point in devising Figure 1 was to try and convince a male-dominated, British bureaucracy that better sanitary methods could seriously diminish the adverse impact of preventable disease amongst military troops on the battlefield. The relative size of the wedges is intended to convey that effect. Later on, she promoted the application of the same sanitation methodologies to public hospitals. She was using the established term of the day,
zymotic disease, to refer to epidemic, endemic, and contagious diseases.


